geneos-good-practice
Geneos Level 2 Monitoring Best Practice Guide
Document Controls
Version 1.2
31st July 2014
Revision History
| Version | Date | Author | Notes |
|---|---|---|---|
| 1.0 | 05/12/2013 | JH | First Draft |
| 1.1 | 08/01/2014 | JH | Revision after initial feedback |
| 1.2 | 31/07/2014 | JH | Copy to new company template |
Contents
Introduction
Purpose
The purpose of this document is to provide information concerning the implementation of best practices for Level 2 Monitoring, encompassing process and log file monitoring.
Scope
The scope of this document is restricted to details of configuration related solely to the implementation of best practices for processes and log file monitoring and does not extend to any explanation related to the general configuration of the Process or FKM Plugins.
Audience
The intended audience for this document is any ITRS personnel or any ITRS client interested in the implementation of best practices for Level 2 monitoring.
Background
The details in this document are the result of the accumulated experience of the Professional Services department implementing Geneos environments for many different clients and are thought to provide the most reliable solution in terms of maintenance and scalability.
Process Monitoring
Application processes can be configured as Single Instance, Active – Passive or Active – Active processes, depending on the needs and/or requirements of the application or organisation.
The following procedures detail the way in which these differences can be accommodated within the configuration in the most straightforward manner, both for monitoring and configuration purposes.
The information contained in this section of the document relates to the best practices for monitoring processes. Although there is specific configuration related to this, this configuration is mostly related to Active – Passive and Active – Active processes. There is no attempt here to provide best practice for general process monitoring or configuration (i.e. use of Samplers, Sampler Includes, Process Descriptors, Variables etc.), as this will be dependent on individual requirements.
Process Monitoring Usage
Once the process monitoring has been configured as detailed in the Configuring Processes the Active Console will display information differently for each process type.
Single Instance Processes
For Single Instance processes, the Active Console Metrics view shows the Instance Count for each process.
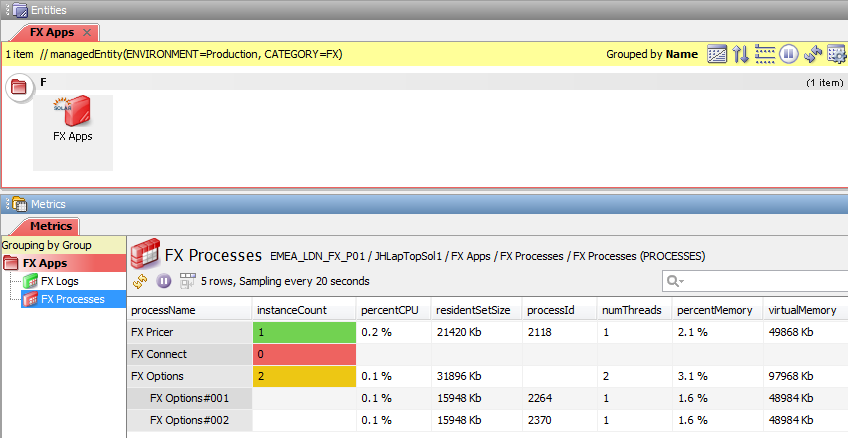
The default Rule for the instanceCount cell will set the severity of the cell to:
OKif the value is equal to 1Warningif the value is greater than 1Criticalif the value is less than 1
Active – Passive Processes
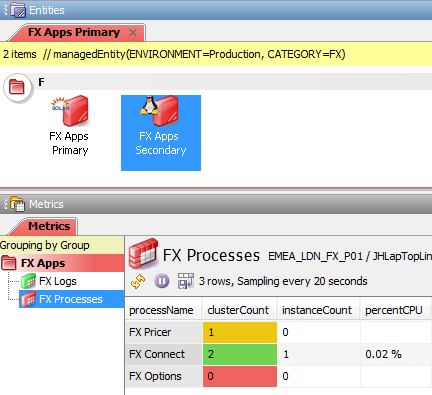
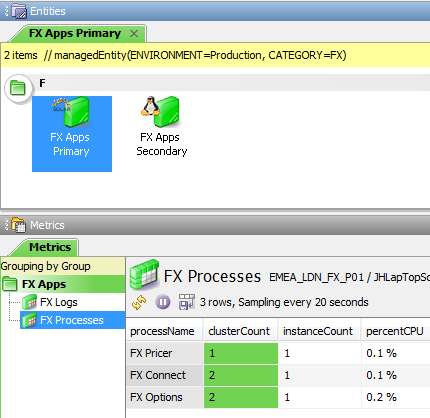
For Active – Passive processes, the Active Console Metrics view shows the Instance Count, but will additionally show the Cluster Count for each process.
For Active – Passive processes it can be expected that the Cluster Count will be either 1 or 0.
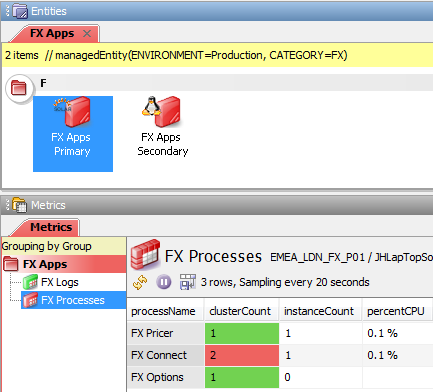
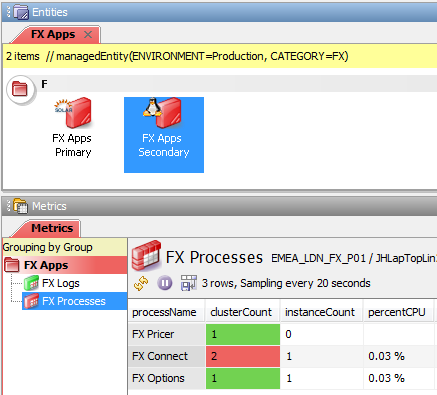
The processName is identical for all instances of a clustered process and this allows instances of the process to be matched across multiple servers.
Each process row contains values for the instanceCount, i.e. the specific process instance for the server, and the clusterCount, i.e. the number of instances of the particular processes that are active across all servers.
In the example above:
- The
clusterCountis1and theinstanceCountis1for the PrimaryFX Pricerprocesses and theclusterCountis1and theinstanceCountis0for the SecondaryFX Pricerprocesses. This is how Active – Passive processes are expected to run and the severity is set toOKaccordingly - The
clusterCountis2and theinstanceCountis1for both the Primary and the SecondaryFX Connectprocesses. This is not how Active – Passive processes are expected to run and the severity is set toCriticalaccordingly - The
clusterCountis1and theinstanceCountis0for the PrimaryFX Optionsprocesses and theclusterCountis1and theinstanceCountis1for the SecondaryFX Optionsprocesses. This is how Active – Passive processes are expected to run when failed over and the severity is set toOKaccordingly
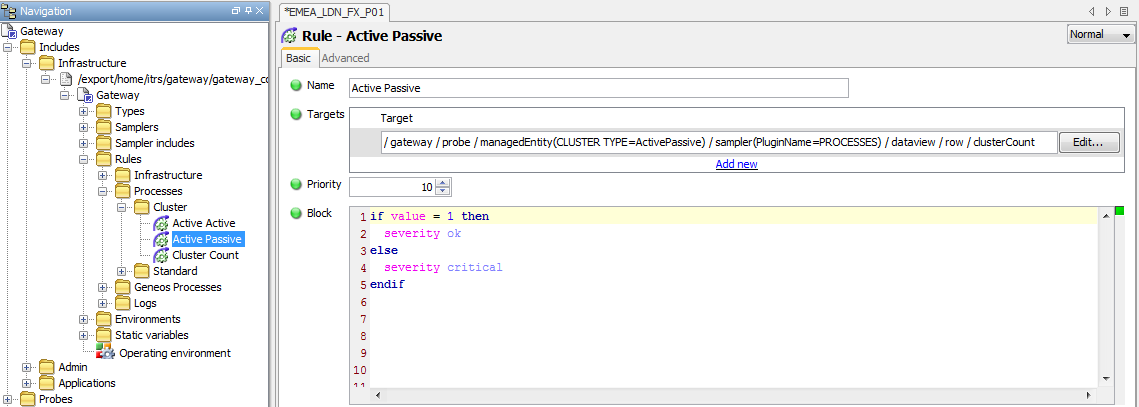
The Rule for clustered processes is not associated with the instanceCount column, but instead is associated with the clusterCount column.
For Active – Passive processes, the default Rule will set the severity of the cell to:
OKif theclusterCountvalue is1Criticalif theclusterCountvalue is not equal1
This allows the user to be informed in the event that both processes are down and also in the event that both processes are up.
Active – Active Processes
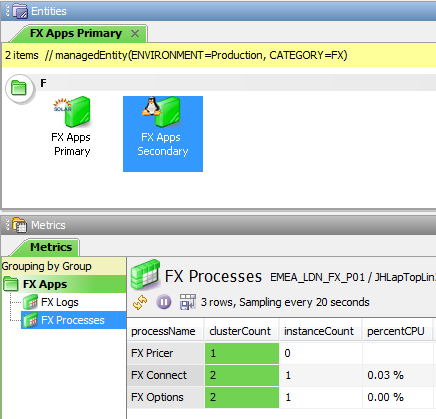
For Active – Active processes, the Active Console Metrics view shows the Instance Count, but will additionally show the Cluster Count for each process in the same manner as for the Active – Passive processes.
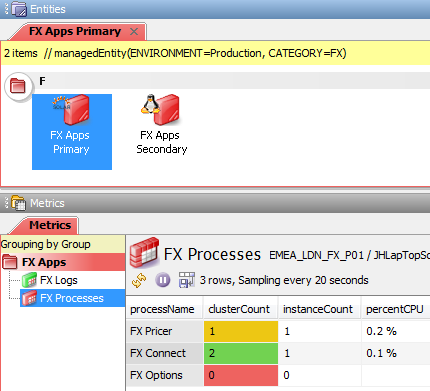
Each process row contains values for the instanceCount, i.e. the specific process instance for the server, and the clusterCount, i.e. the number of instances of the particular processes that are active across all servers.
In the example above:
- The
clusterCountis1and theinstanceCountis1for the PrimaryFX Pricerprocesses and theclusterCountis1and theinstanceCountis0for the SecondaryFX Pricerprocesses. This implies that the Active * Active processes is not running correctly. Although one of the clustered processes has failed, the application is still available, even though there might beloadissues. To indicate that attention is needed the severity is set toWarning - The
clusterCountis2and theinstanceCountis1for both the Primary and the SecondaryFX Connectprocesses. This is how Active – Active processes are expected to run and the severity is set toOKaccordingly - The
clusterCountis0and theinstanceCountis0for both the Primary and the SecondaryFX Optionsprocesses. This indicates that the application has failed and the severity is set toCriticalaccordingly
The Rule for clustered processes is not associated with the instanceCount column, but instead is associated with the clusterCount column.
The severity for cells is based on the value assigned to 2 variables:
activeActiveCritical: the number of processes at which the severity is set toCritical(usually 0)activeActiveOK: the number of processes expected to exist in the cluster
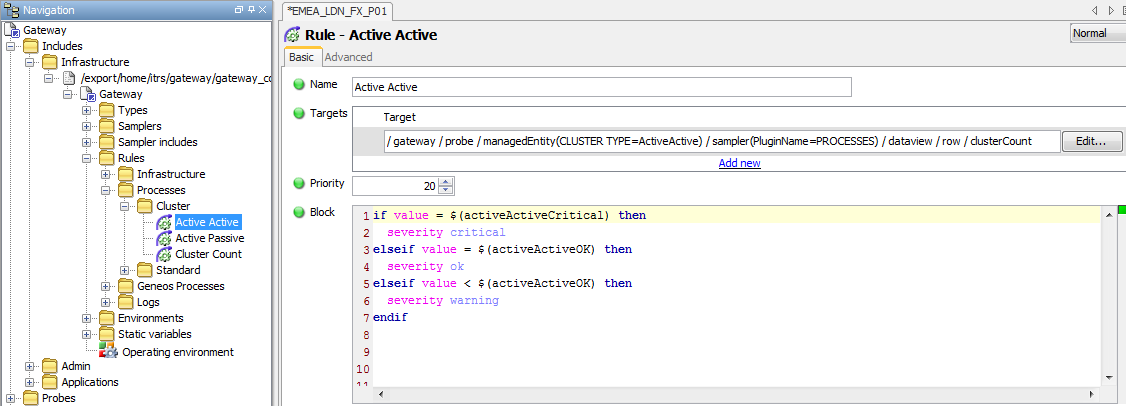
The default Rule will set the severity of the cell to:
-
OKif theclusterCountvalue is equal to the value set for theactiveActiveOKvariable -
Warningif theclusterCountvalue is less than the value set for theactiveActiveOKvariable -
Critical if the
clusterCountvalue is equal to the value set for theactiveActiveCriticalvariable
Process Monitoring Configuration
The document will not describe how to configure individual processes, as it is expected that this information is either already known or available from other sources.
Where there are specific differences or additions to process configuration to accommodate the required type of process monitoring, these details will be included.
Single Instance Processes
Processes should be created in accordance with normal practice.
The default Rule for Single Instance Processes (see Processes Rules in the Appendix section) has been configured to select instanceCount cells where the Managed Entity Attribute CLUSTER TYPE is equal to Single and where the Sampler is using the PROCESSES Plugin.
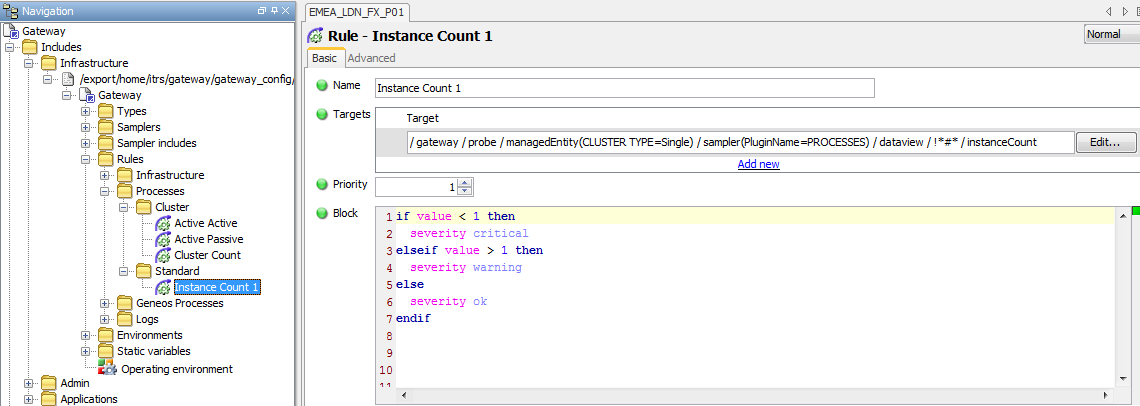
N.B. If there is no requirement for clustered processes, the target for this Rule can be changed to select all instanceCount cells, and this would remove the requirement to perform the following action.
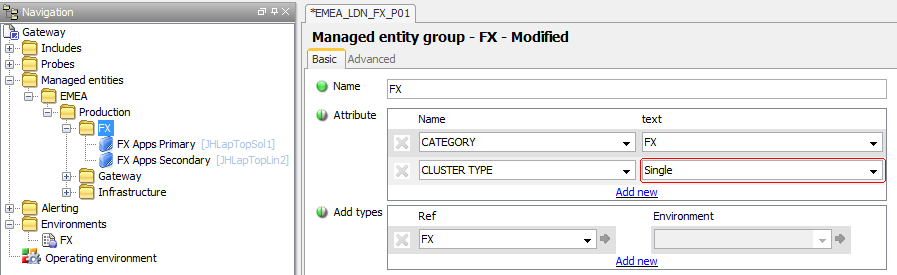
To ensure that Single Instance processes use this Rule it is necessary to add a CLUSTER TYPE Attribute with a value of Single to the relevant Managed Entity Group or Managed Entity
Clustered Processes
If processes are not single instance processes, then they will be clustered in some way to provide resilience and/or load balancing.
Active – Passive processes are used for resilience only. In these instances there will be one process that is up and running and a second process that is inactive. If the active process fails the secondary processes will become active (this can be either manual or automatic and is not relevant to the monitoring of the cluster).
There should therefore only ever be one process of an Active – Passive pair active at any time and the monitoring is configured to reflect this.
N.B. Active - Passive processes are not clustered in the technical sense of the term, but can be considered clustered in terms of the way in which the processes are monitored here.
Active – Active processes are used for resilience and load balancing. In these instances there can be any number of processes in the cluster. All processes are active and the application is available through any one of the instances. When one of the processes fails the application is still available, although the connections to the application will be reduced and the consequent load on the remaining instances will be increased.
The monitoring for Active – Active processes is configured to reflect the number of processes in any cluster and also the number at which a Critical alert should be raised. By default, a Warning alert is raised if the number of processes drops below the number of processes in the cluster, but this can be changed to be any required number.
Clustered Processes Rule
The Rule that calculates the number of processes in a cluster is called Cluster Count and has a target of any cell in the clusterCount column where the row name is not equal to *#*, i.e. all Summary information rows.
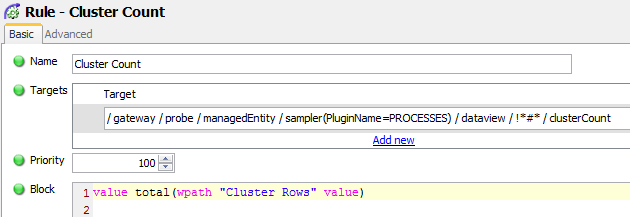
The Rule will add up the values of all of the instanceCount cells where the Row Name is the same as the target $rowName and the Type for the Process is the same as the target $samplerType.
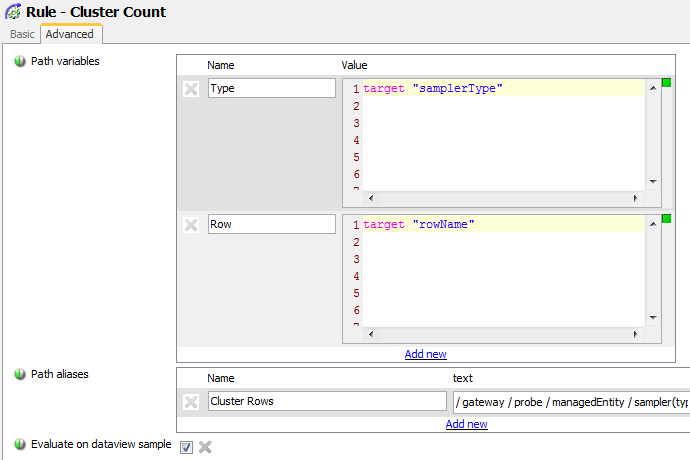
The Path for the Path alias looks as follows:
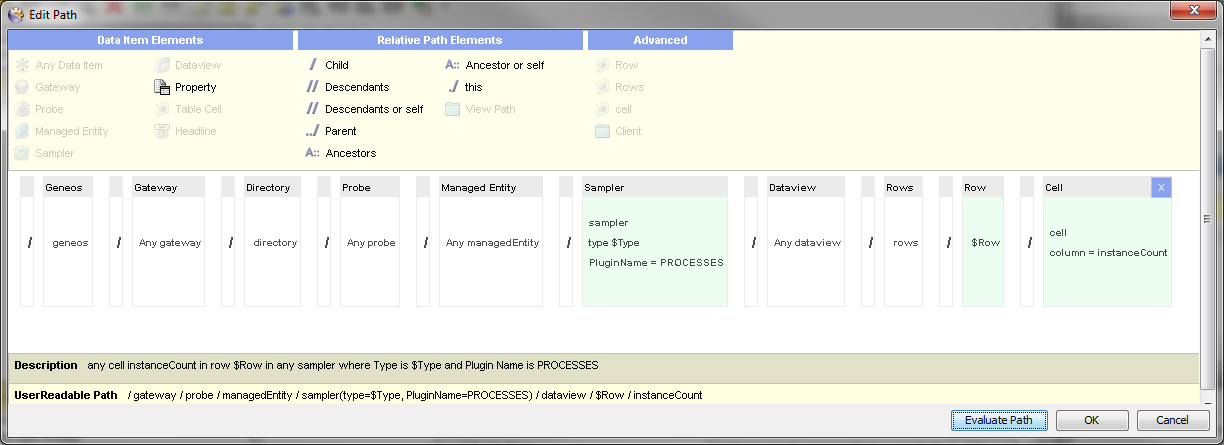
N.B. There are two important factors relating to this configuration:
- The use of the target for the
Cluster CountRule implies that the Process Sampler has been set to showSummaryinformation (this should normally be the case otherwise the instanceCount column would not be available for the underlying processes) - The use of the
totalfunction in the Rule implies thatCompute Engineis included in the licence for the client. If this is not the case, then it would not be possible to configure monitoring for clustered processes in this manner.
Clustered Processes Sampler
The above Rule has a target of the clusterCount column. This column does not exist by default in the Processes Sampler configuration and must be added for both Active – Passive and Active – Active processes.
To add the column it is necessary to:
-
Configure the relevant Processes Sampler to have a
clusterCountColumn, by setting theAdditionsoptions in theDataviewssection of the Advanced tab settings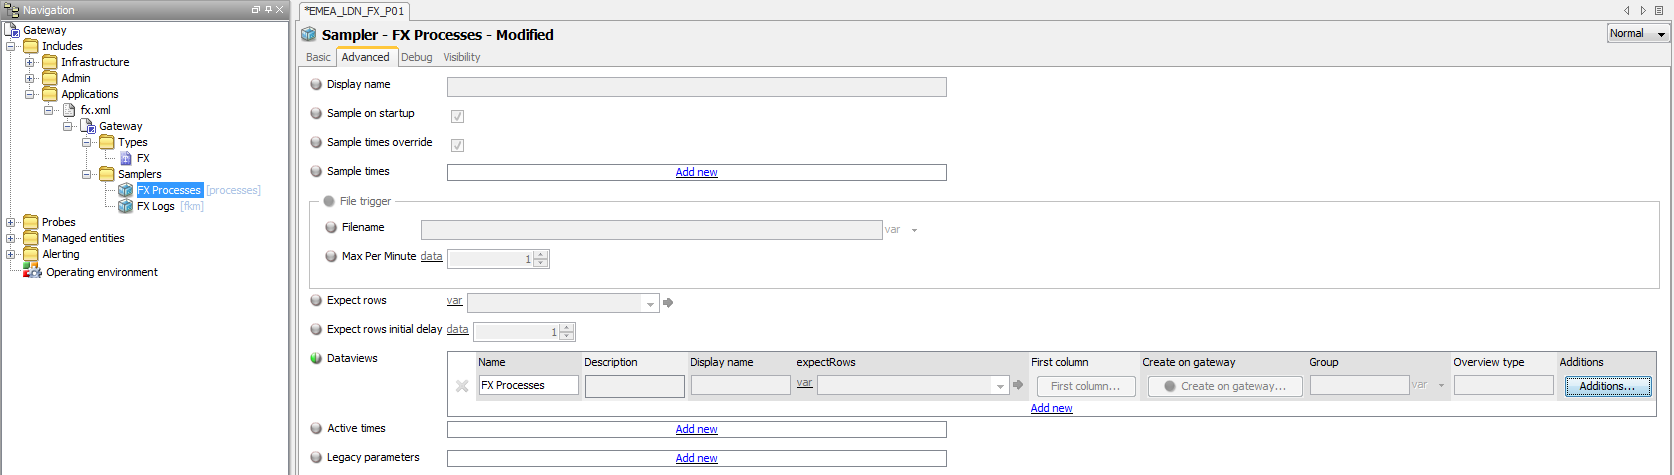
-
The
Additionssetting should contain a single setting for theclusterCountColumn, as follows: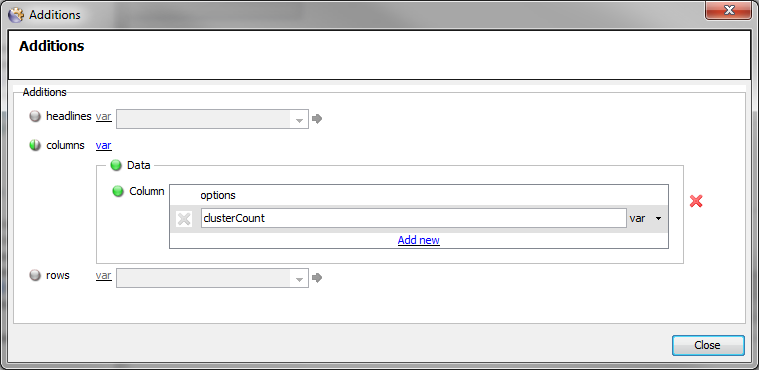
It is also necessary to configure each process within the cluster to have the same name. The best way to achieve this it to ensure that the same Sampler configuration is used for both Managed Entities:
Active – Passive Processes
Processes should be created in accordance with normal practice and the additional cluster procedures outlined in Clustered Processes Rule and Clustered Processes Sampler above.
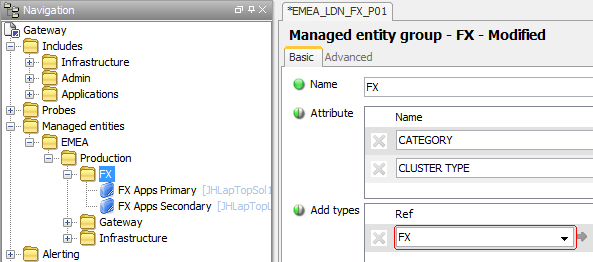
The default Rule for Active – Passive Processes (see Processes Rules in the Appendix section) has been configured to select clusterCount cells where the Managed Entity Attribute CLUSTER TYPE is equal to ActivePassive and where the Sampler is using the PROCESSES Plugin.
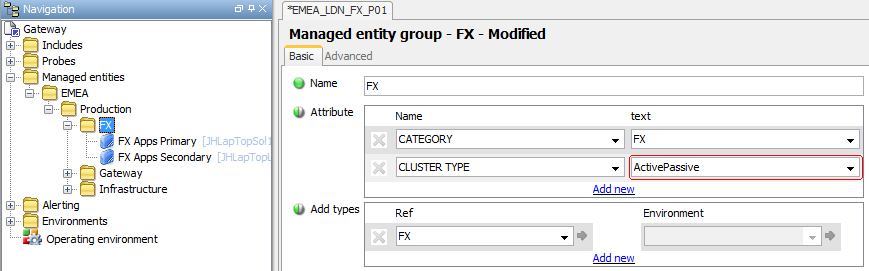
To ensure that Active - Passive processes use this Rule it is necessary to add a CLUSTER TYPE Attribute with a value of activePassive to the relevant Managed Entity Group or Managed Entity
Active – Active Processes
Processes should be created in accordance with normal practice and the additional cluster procedures outlined above in Clustered Processes Rule and Clustered Processes Sampler.
The default Rule for Active – Active Processes (see Processes Rules in the Appendix section) has been configured to select clusterCount cells where the Managed Entity Attribute CLUSTER TYPE is equal to ActiveActive and where the Sampler is using the PROCESSES Plugin.
The Rule checks the cell value against the value of one of two Variables; activeActiveCritical or activeActiveOK.
For this Rule to work for Active – Active processes it is necessary to assign values to the relevant Variables, as follows:
-
Assign the appropriate values to the
activeActiveCriticalandactiveActiveOKVariables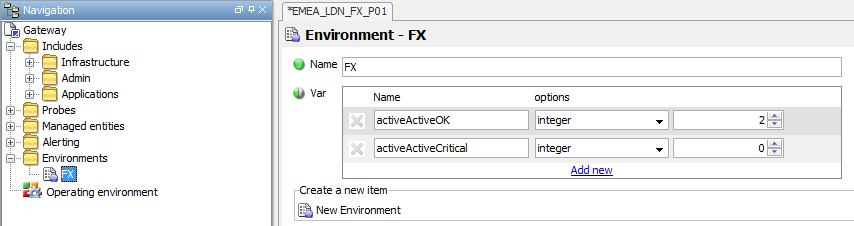
-
Assign the Environment to the relevant Managed Entities
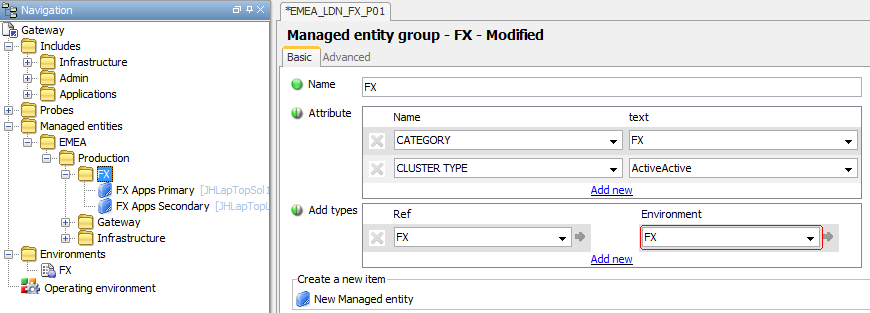
N.B. An
Environmentshould only be added to theAdd typesSection of a Managed Entity Group if it is certain that all Managed Entities belonging to the group will use these Variable settings. Variables placed here cannot be overwritten and in all other instances the Environment must be added to theEnvironmentsection in the Advanced Tab of the individual Managed Entities. -
If the
Warningalert is required when the number of processes in the cluster reaches a value other than one less than the number of processes in the cluster, then the warning transaction in the Rule should be changed so that it uses a different Variable (e.g.$activeActiveWarning) and the additional Variable added to the list of Variable in the Environment in Step 1 above
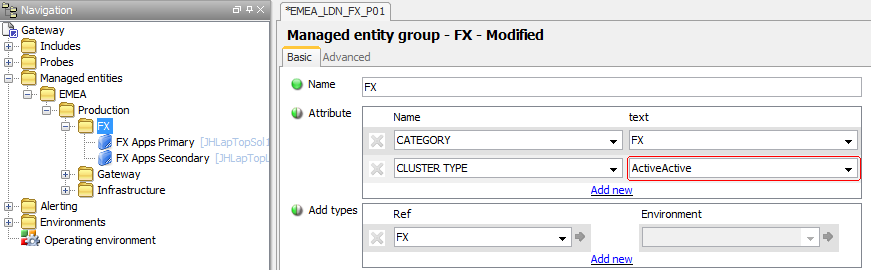
To ensure that Active - Active processes use this Rule it is necessary to add a CLUSTER TYPE Attribute with a value of ActiveActive to the relevant Managed Entity Group or Managed Entity
Adding a different Cluster setting to a Row
Using the CLUSTER TYPE Attribute it is possible for different Managed Entities within the same Managed Entity Group to be configured to display different cluster types.
However, it is not possible to use the CLUSTER TYPE Attribute where there is a requirement to have different processes within the same Managed Entity display different cluster types.
To enable this, the following procedure should be followed:
-
Check the priority of the
Active ActiveandActive PassiveRules - The Rule with the highest priority (lowest number) is the Cluster Type that must be used at Row level -
Ensure that the Cluster Type with the lower priority Rule is set as the
CLUSTER TYPEAttribute for the Managed Entity (if this makes administration difficult it might be easier to create a separate Managed Entity for the different cluster process) -
Add the relevant Row(s) for the Cluster Type with the higher priority as separate Targets in the relevant
Active ActiveorActive PassiveRules. For instance; to set theFX Pricerprocess to Active – Passive, add the target for that process to theActivePassiveRule: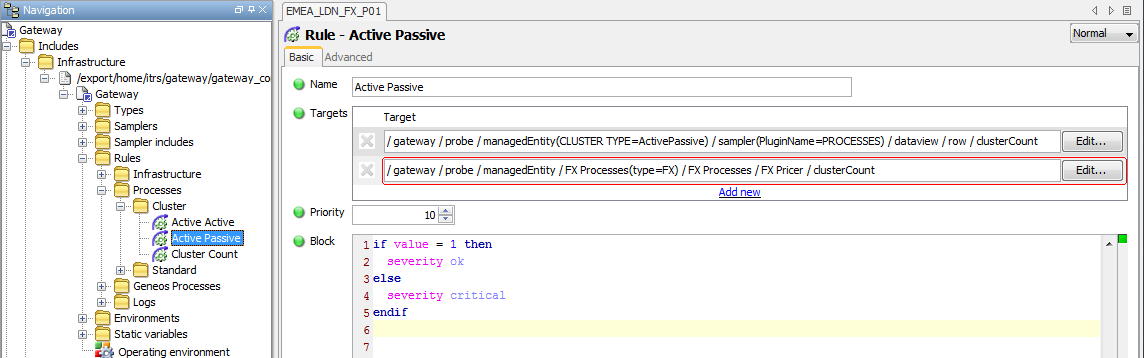
-
Check that the output is displaying correctly for the individual rows:
N.B. This procedure can also be followed to add a Single Cluster Type to an individual Row within a Managed Entity that already uses either the Active Active Rule or the Active Passive Rule. However, it will also be necessary to additionally create a separate Rule to set the Severity to Undefined for the clusterCount column of the process
Log File Monitoring
The FKM plugin is one of the key elements within Geneos to provide application monitoring.
The functionality of the plugin is extremely flexible and versatile to accommodate a wide variety of use case scenarios. Although this is useful, it often leaves clients with a basic configuration that is unsuited to the continuous improvement necessary to provide the most efficient monitoring over time.
These Best Practices have been developed to encourage the continuous improvement of log file monitoring.
Log File Monitoring Usage
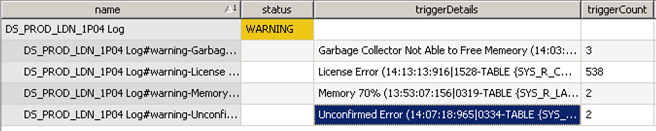
Once the Log File monitoring has been configured as detailed in the Log File General Configuration section and has been running long enough for some initial changes to be made, as described in the Fine-Tuning Log File Monitoring section, the output for a specific log file might look similar to the following:
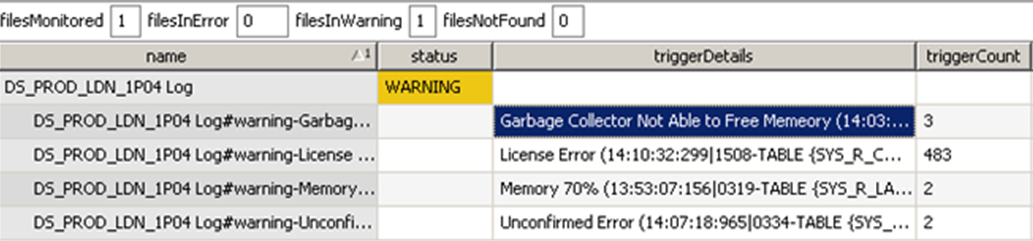
A row is displayed each time a specified keyword is encountered in any line within the monitored file.
The rows are grouped by the keyword that has been encountered in the file. The triggerCount column indicates the number of times a particular keyword has been encountered within the file since the last time the trigger was cleared or the file accepted. As well as showing how often a message has been detected, this also helps the user to decide how relevant a particular message might be.
The FKM Sampler has been configured in such a way that an indicative message is both appended to the row name and pre-pended to the triggerDetails cell.
The example shows that there have been 3 Garbage Collector.. errors, 483 License Errors, 2 Memory 70% errors and 2 Unconfirmed Errors.
Use the Show Tables option from the right-click menu for a file to see what keywords are being search for within the file.
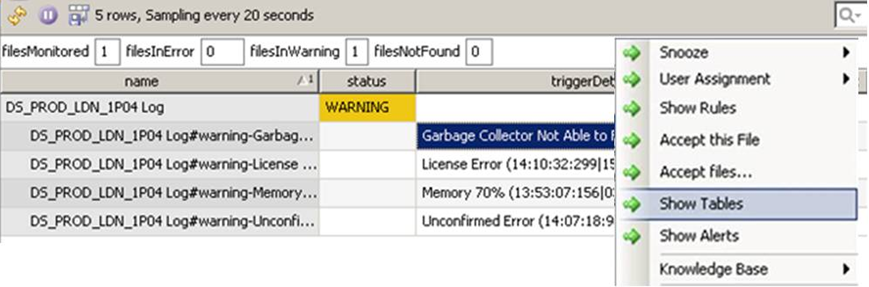
This will show something similar to the following:
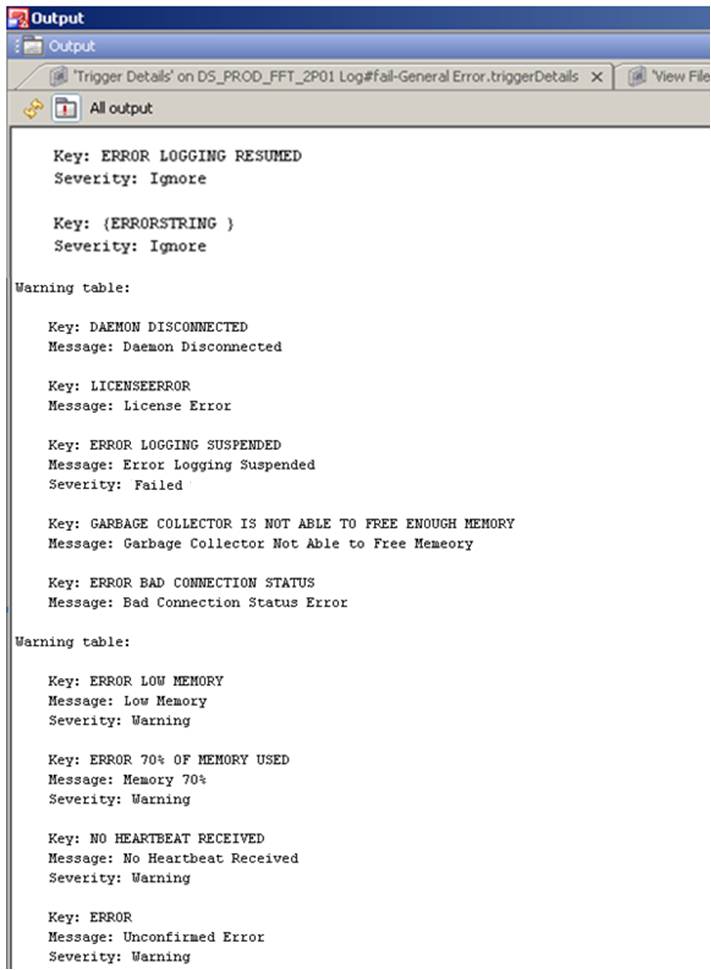
- Keys with a severity of
Ignoreresult in the entire line being discarded from further searches if the key is encountered - Tables can be either
FailedorWarning - UPPERCASE keys indicate a case-insensitive search. The entry
(Regex)at the end of a key indicates a case-sensitive Regex search - The
Severityof a key within a specific table can be set independently so as to be different from the severity of the table if required - The value after
Message:indicates the text that is appended to the row name and prepended to the triggerDetails cell value
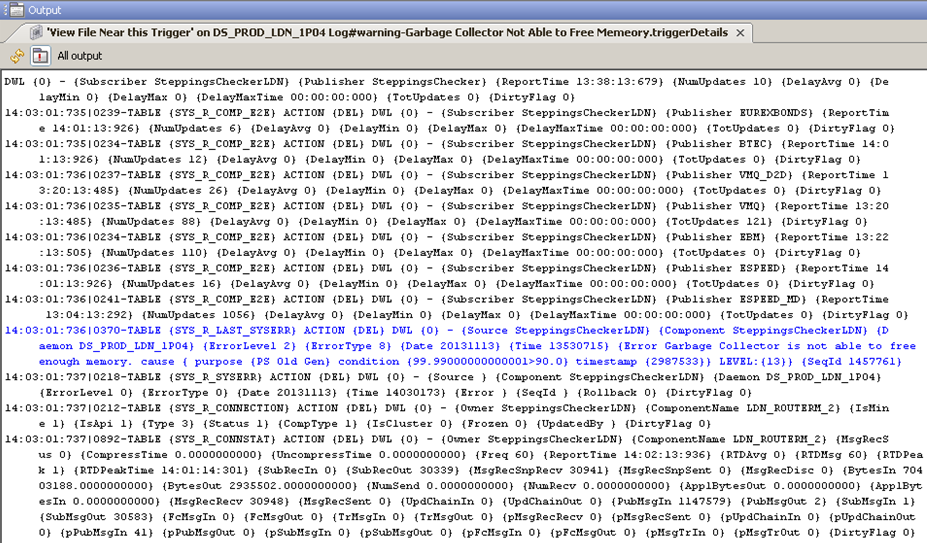
Use the View File Near this Trigger from the right-click menu for a trigger to investigate a specific keyword
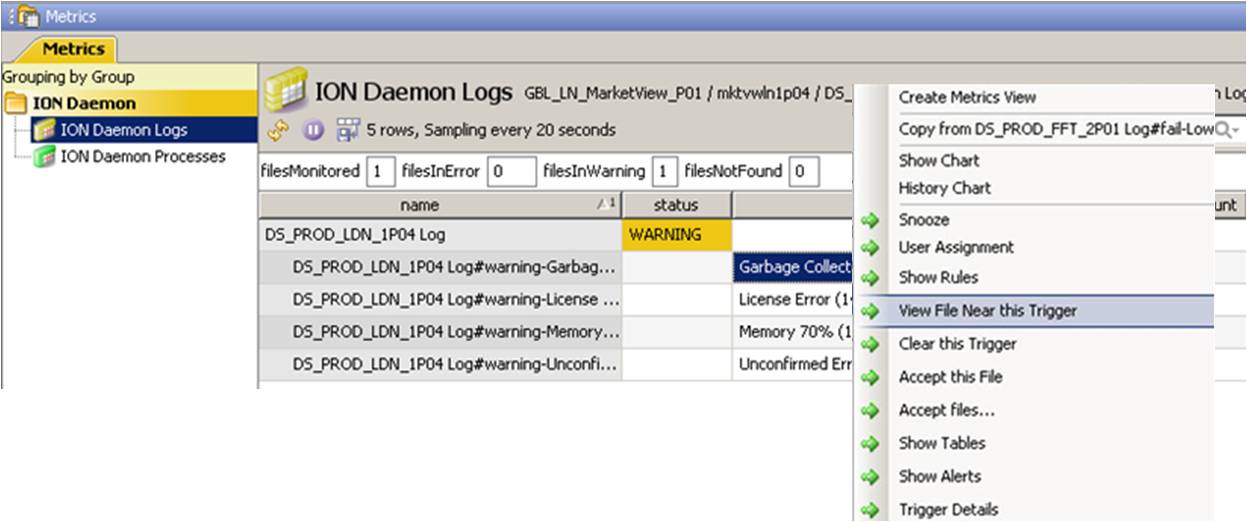
This will display the line containing the keyword encountered highlighted in blue, together with a section of log file both before and after the event.
The messages for Memory 70% etc. in the FKM DataView indicate that the keyword search has been configured for specific error messages.
All messages found for these specific keyword searches should be from the same source event. The Message text should indicate this, allowing the user to understand the situation more clearly, reducing the time taken to investigate and clear the event.
The Unconfirmed Errors (or Unconfirmed Failures and Unconfirmed Aborts) row shows the messages discovered that contain non-specific keyword searches, such as the word error, fail or abort, that will result in matches for messages from potentially very different events.
Continuous improvement relies on being able to sort these Unconfirmed messages into messages that can be either ignored or messages that should be monitored.
It is therefore important to be able to see what the actual messages are for these Unconfirmed Errors and to decide whether each specific message should be ignored or configured as a separate key.
Use the Trigger Details option from the right-click menu for a trigger (in this case the Unconfirmed Errors trigger) to display all of the keys that have been encountered for the key.
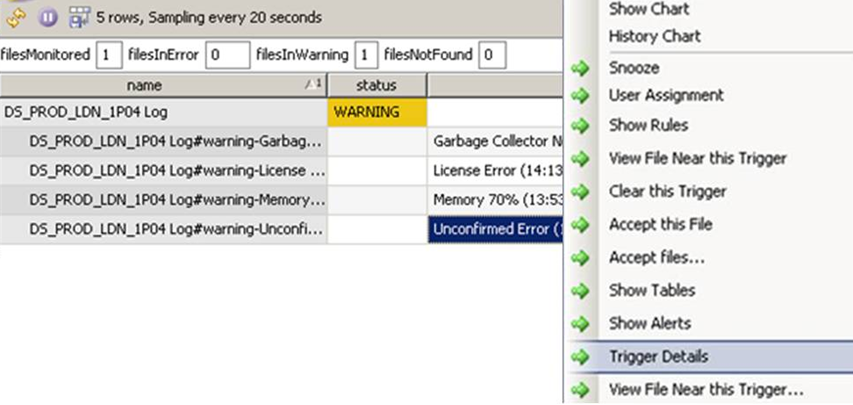
This will display all of the separate triggers for the Unconfirmed Error keyword in question (this is the keyword ERROR as shown by the Show Tables output).
Using the Find... option from the right-click menu for the Output window, it is then possible to search for all occurrences of the word Error in the output, , and decide how the individual messages should be handled.
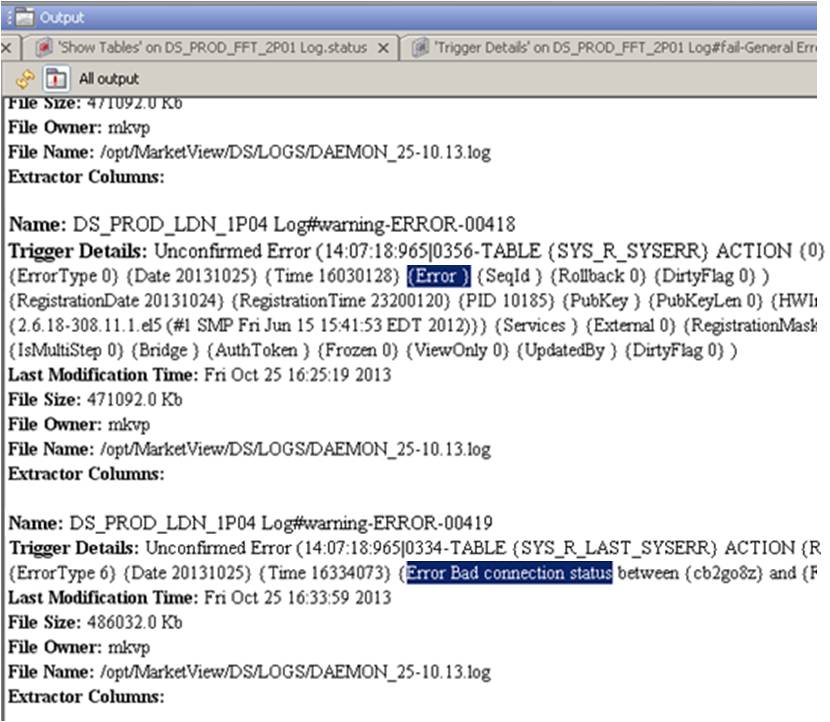
In this example, the first message seems to be an information message and the various occurrences of Error...` relate to a non-error state.
The most suitable non-error indicator should be added to the <APP>_IGNORE table, or the GENERAL_IGNORE table if it is thought that the format can be used to ignore similar messages for other applications as well
- In the second message,
Error Type 6should probably not be used as it might also relate to different events - The phrase
Error Bad connection status between ...should be used to create a separate trigger for this event and placed in the<APP>_WARNINGtable
In this manner, the number of matches from the Unconfirmed Error keyword should reduce and the number of meaningful, relevant messages should increase.
Log File Monitoring Best Practices
The purpose of the above configuration is to aid the creation of a system that monitors application log files for pertinent events only and which allows the user to become pro-active in their response to events.
This should reduce the number of application and system outages and so increase the availability and stability of applications.
It should be taken as a matter of good practice to only configure a message with a FKM Severity of Fail if the message indicates an actual system or application failure.
All other message events should be set to an FKM Severity of Warning (or Ignore).
In order to fine tune the log file monitoring the following procedures should be followed:
- Check the contents of the
Unconfirmed Errormessages as soon as messages appear - Configure
Unconfirmed Errormessages as:- Ignore Keys
- Warning Keys
- Failed Keys (only for system or application failures)
- Check relevance of configured messages:
- How frequent are messages?
- How well do messages relate to actual events, i.e. is it possible to tell from a message what event has taken place?
- For in-house applications; feedback information to development teams to:
- Reduce message numbers
- Increase message relevance
- For 3rd-Party applications:
- If frequent/non-relevant messages are not affecting application behaviour – Ignore
- If frequent/non-relevant messages are affecting application behaviour – see if fine-tuning is possible, and/or feedback information to 3rd party to improve the application behaviour
Once the initial fine-tuning stage has been completed there should be no (or very infrequent) Unconfirmed Error messages (please note that this is a gradual process that can take up to 3 months or more to complete, depending on how much time can be allocated to this work).
After this time there might be a large number of entries in the various IGNORE tables and this has the potential to degrade the performance of the FKM Plugin.
It is possible at this point to remove the Unconfirmed Error, Unconfirmed Abort and Unconfirmed Fail keys (i.e. the UNCONFIRMED_MESSAGES FKM Table can be removed from all Sampler configuration). This will allow all of the IGNORE keys (that contained those key words) to also be deleted and so improve the performance of the FKM Plugin.
The disadvantage of doing this is that any message that has previously not been encountered that contains one of the general Unconfirmed message keys will not get picked up by the system.
For these errors, the support team initially become re-active as they can only enter the new message once it has become apparent through the behaviour of the system or application.
It is up to the application support team to decide between the relative merits of the performance of the FKM plugin over the number of potential events to which they might become re-active.
Dealing With Issues During Initial Improvement Process
It has already been stated that the fine-tuning stage can take a number of months to complete.
During this time it is likely that the FKM DataViews and the Managed Entities to which they belong will be constantly at a Warning severity. This will be due to the high number of:
- Unconfirmed messages that haven`t yet been sorted
- Messages that have been sorted, but which are in an investigation stage, such as the multiple
Licence Errormessages in the above example
While this state continues, any system or application failure messages with an FKM Severity of Fail will be spotted immediately as the Severity of the DataView and Managed Entity will change to Critical.
However, in cases where it is not possible to continually check the status of the FKM alerts, it will be difficult to spot occurrences of confirmed messages with an FKM Severity of Warning, as these will be masked by the continuous Warning state of the DataView and Managed Entity.
If this is likely to be the case it is advised to perform the following in order that these messages can be spotted during the fine-tuning phase:
- Only place confirmed non-system and application failure messages in the
<APP_WARNING>table where it is known that an action is required - Set the severity of the
<APP_WARNING>table toFailin the relevant FKM sampler during the initial fine-tuning phase - Place confirmed message that require investigation into a separate
<APP_INVESTIGATE>table - Set the Severity of the
<APP_INVESTIGATE>table toWarningin the relevant FKM Sampler - Once all messages have been moved out of the
<APP_INVESTIGATE>table and the initial fine-tuning stage is completed, change the severity of the<APP_WARNING>table toWarningin the relevant FKM sampler
Log File Monitoring Configuration
General Configuration
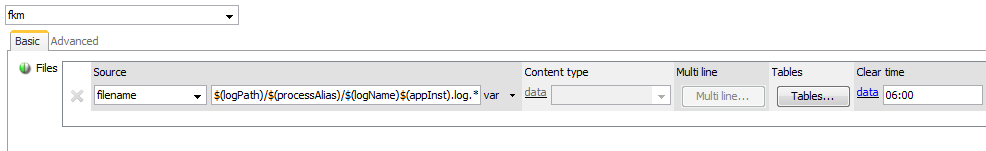
Each instance of an FKM Sampler should have the same base configuration.
The configuration for this is in the advanced tab of each FKM Sampler and it is important to remember to use this configuration whenever new FKM Samplers are created:
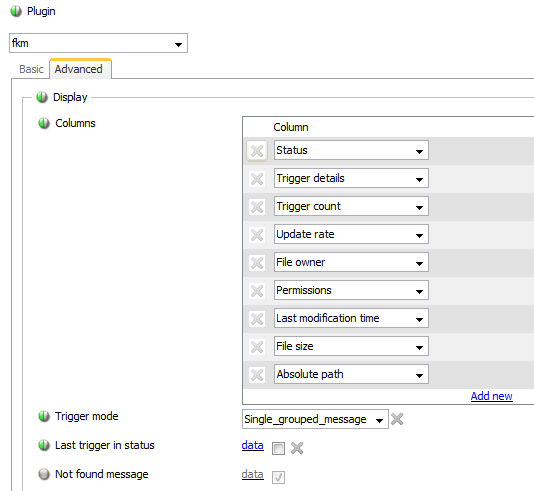
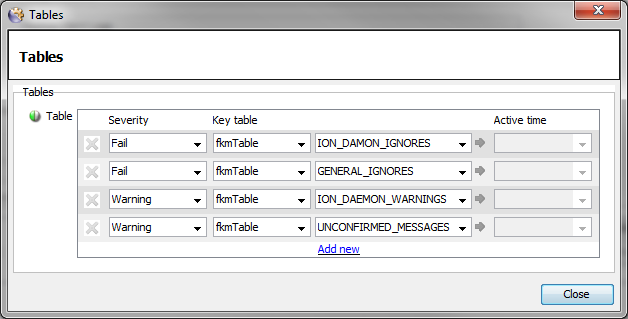
For each new log file that is configured, ensure that the following, minimum Table definitions are set:
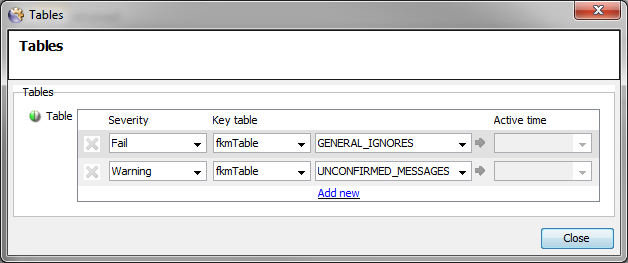
The GENERAL_IGNORES Table can initially be empty.
The UNCONFIRMED_MESSAGES should contain entries for any general
keywords required, such as:
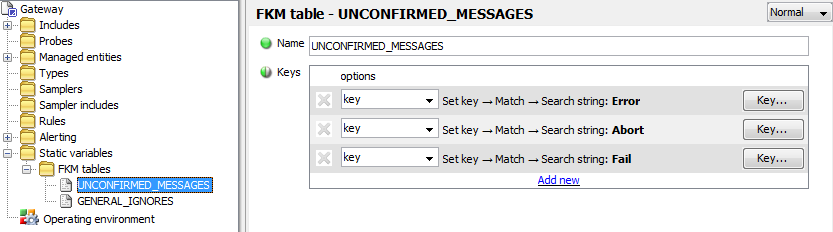
Each key should have configuration similar to the following:
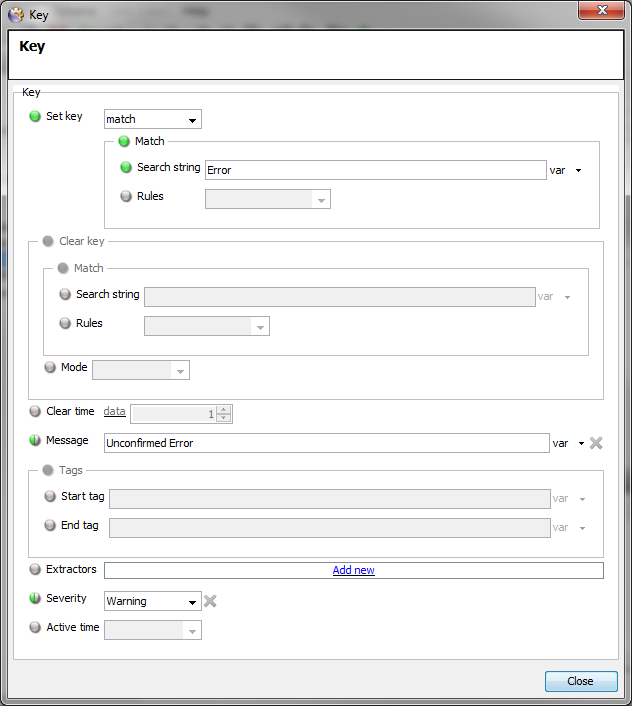
- The general message match key
- The Message text
- Hardcoded severity set to
warningin case the Table is accidentally set with aFailedseverity within the FKM Sampler definition
It might also be considered to initially set a Clear Time on the file as there can potentially be thousands of Unconfirmed messages.
These can be removed once some initial message management has taken place.
Fine-Tuning Log File Monitoring
Whenever Unconfirmed Errors (or Abort and Fails) appear, these should be investigated to decide whether the message can be ignored or need to be created as individual keys.
Messages should not be left to reappear as Unconfirmed Errors (or Abort and Fails).
As detailed in the Usage section above, the Trigger Details option can be used to discover the different triggers for each occurrence of the relevant keyword.
Each separate occurrence should then be created as either an ignore key or as a separate alert key.
It also needs to be decided whether an ignore key is added to the GENERAL_IGNORE table or to a separate <APPLICATION>_IGNORE table, remembering that too many entries in the GENERAL_IGNORE table can have a detrimental effect on the performance of the FKM Plugin.
To add a new Ignore Key to an existing IGNORE Table, perform the following:
-
Add a new Key line and select
Ignore Keyfrom the drop-down list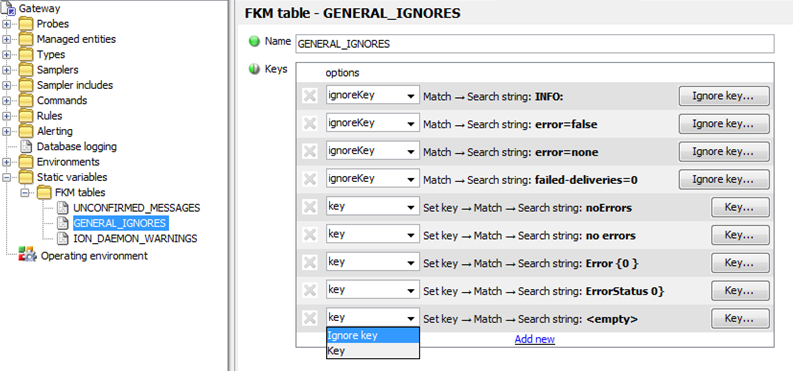
-
Add the Ignore Key details as required, ensuring to select
Basicfrom theRulesdrop-down list where the key include Regex characters that are not to be treated as such, but are to treated as text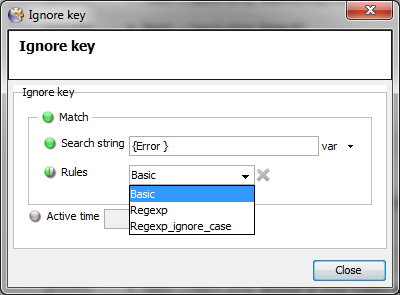
-
Save the configuration
To add a new Key to an existing WARNING or FAIL Table, perform the following:
-
Add a new Key line and select
Ignore Keyfrom the drop-down list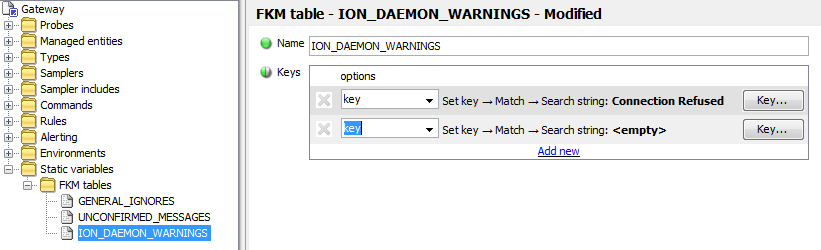
-
Add the Key details and the Message details as required, ensuring to select the relevant option from the
Rulesdropdown list as required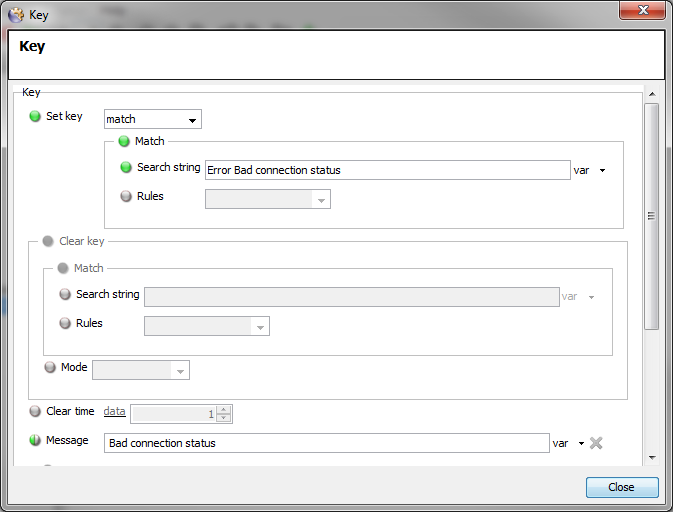
-
Save the configuration
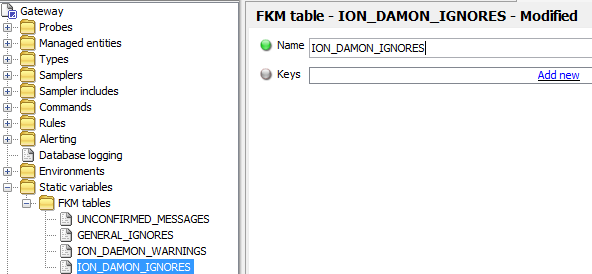
If there is no <APP>_WARNINGS, <APP>_FAIL, or <APP>_IGNORES Tables and the configuration requires these to be created, perform the following:
-
Create the required Table
-
Create the required keys as described above
-
Add the Table to the relevant FKM Sampler or Sampler Include file
-
Select Severity
Warningfor WARNING Tables and SeverityFailfor FAIL and IGNORE Tables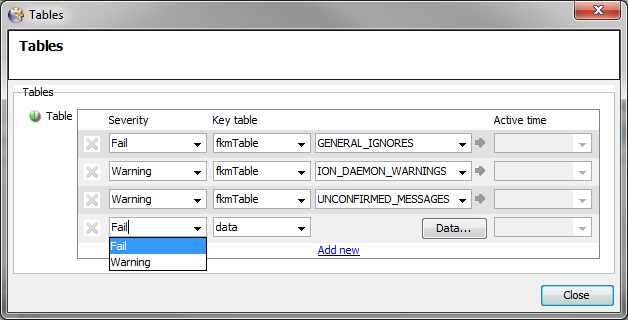
-
Select Key table type
fkmTable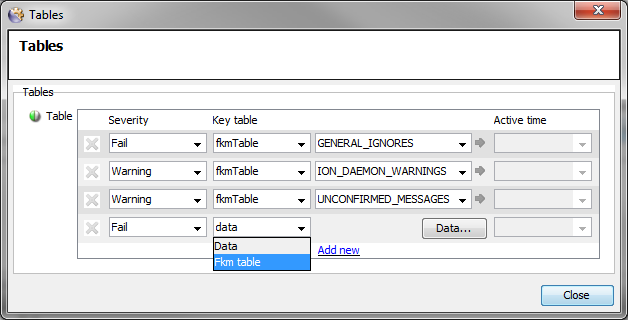
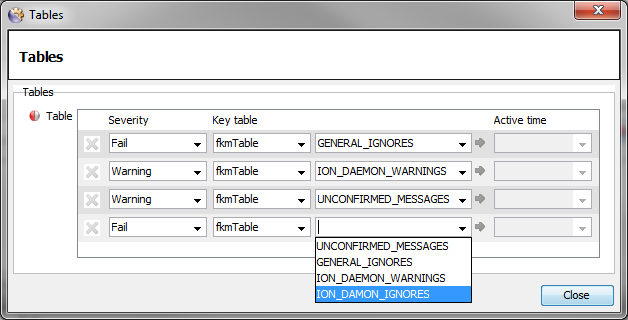
-
Select the required FKM Table
-
Ensure that the Table order is correct by using the right-click
Move row uporMove row to topoptions to re-order any Tables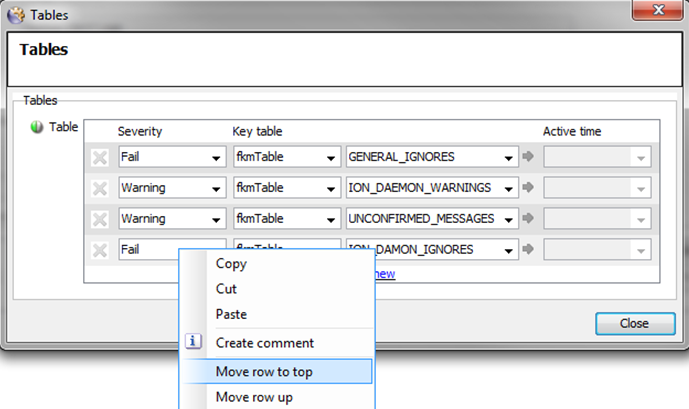
The ordering of the Tables should be as follows:
<APP>_IGNORESGENERAL_IGNORES<APP>_FAILS<APP>_WARNINGSUNCONFIRMED_MESSAGES
-
-
Ensure that the Table is added to all log files for the application
-
Save the configuration
Appendix
Process Configuration
Processes Rules
<ruleGroup name="Processes">
<ruleGroup name="Cluster">
<rule name="Active Active">
<targets>
<target>/geneos/gateway/directory/probe/managedEntity[(attr("CLUSTER TYPE")="ActiveActive")]/sampler[(param("PluginName")="PROCESSES")]/dataview/rows/row/cell[(@column="clusterCount")]</target>
</targets>
<priority>20</priority>
<evaluateOnDataviewSample>true</evaluateOnDataviewSample>
<block>
<if>
<equal>
<dataItem>
<property>@value</property>
</dataItem>
<var ref="activeActiveCritical"></var>
</equal>
<transaction>
<update>
<property>state/@severity</property>
<severity>critical</severity>
</update>
</transaction>
<if>
<equal>
<dataItem>
<property>@value</property>
</dataItem>
<var ref="activeActiveOK"></var>
</equal>
<transaction>
<update>
<property>state/@severity</property>
<severity>ok</severity>
</update>
</transaction>
<if>
<lt>
<dataItem>
<property>@value</property>
</dataItem>
<var ref="activeActiveOK"></var>
</lt>
<transaction>
<update>
<property>state/@severity</property>
<severity>warning</severity>
</update>
</transaction>
</if>
</if>
</if>
</block>
</rule>
<rule name="Active Passive">
<targets>
<target>/geneos/gateway/directory/probe/managedEntity[(attr("CLUSTER TYPE")="ActivePassive")]/sampler[(param("PluginName")="PROCESSES")]/dataview/rows/row/cell[(@column="clusterCount")]</target>
</targets>
<priority>10</priority>
<block>
<if>
<equal>
<dataItem>
<property>@value</property>
</dataItem>
<integer>1</integer>
</equal>
<transaction>
<update>
<property>state/@severity</property>
<severity>ok</severity>
</update>
</transaction>
<transaction>
<update>
<property>state/@severity</property>
<severity>critical</severity>
</update>
</transaction>
</if>
</block>
</rule>
<rule name="Cluster Count">
<target>
<target>/geneos/gateway/directory/probe/managedEntity/sampler[(param("PluginName")="PROCESSES")]/dataview/rows/row[not(contains(@name,"#"))]/cell[(@column="clusterCount")]</target>
</targets>
<priority>100</priority>
<pathVariables>
<pathVariable name="Type">
<value>
<target>
<samplerType></samplerType>
</target>
</value>
</pathVariable>
<pathVariable name="Row">
<value>
<target>
<rowName></rowName>
</target>
</value>
</pathVariable>
</pathVariables>
<pathAliases>
<pathAlias name="Cluster
Rows">/geneos/gateway/directory/probe/managedEntity/sampler[(@type=var("Type"))][(param("PluginName")="PROCESSES")]/dataview/rows/row[(@name=var("Row"))]/cell[(@column="instanceCount")]</pathAlias>
</pathAliases>
<evaluateOnDataviewSample>true</evaluateOnDataviewSample>
<block>
<transaction>
<update>
<property>@value</property>
<total>
<dataItems>
<pathAlias ref="Cluster Rows"></pathAlias>
<property>@value</property>
</dataItems>
</total>
</update>
</transaction>
</block>
</rule>
</ruleGroup>
<ruleGroup name="Standard">
<rule name="Instance Count 1">
<targets>
<target>/geneos/gateway/directory/probe/managedEntity[(attr("CLUSTER TYPE")="Single")]/sampler[(param("PluginName")="PROCESSES")]/dataview/rows/row[not(contains(@name,"#"))]/cell[(@column="instanceCount")]</target>
</targets>
<priority>1</priority>
<block>
<if>
<lt>
<dataItem>
<property>@value</property>
</dataItem>
<integer>1</integer>
</lt>
<transaction>
<update>
<property>state/@severity</property>
<severity>critical</severity>
</update>
</transaction>
<if>
<gt>
<dataItem>
<property>@value</property>
</dataItem>
<integer>1</integer>
</gt>
<transaction>
<update>
<property>state/@severity</property>
<severity>warning</severity>
</update>
</transaction>
<transaction>
<update>
<property>state/@severity</property>
<severity>ok</severity>
</update>
</transaction>
</if>
</if>
</block>
</rule>
</ruleGroup>
</ruleGroup>